Proceedings of the Microgravity Transport Processes in
Fluid, Thermal, Biological and Materials Sciences III
Davos, Switzerland.
September 14 to 19, 2003
Design and Preparation
of a
Particle Dynamics Space Flight Experiment, SHIVA
|
James Trolinger / MetroLaser, Irvine, CA |
Drew L’Esperance / MetroLaser, Irvine, CA |
||
|
Roger Rangel / University of California at Irvine
|
Carlos Coimbra / University of Hawaii |
William Witherow / NASA Marshall Space Flight Center |
|
ABSTRACT
This paper describes the flight experiment, supporting ground science, and the design rationale for project SHIVA (Spaceflight Holography Investigation in a Virtual Apparatus). SHIVA is a fundamental study of particle dynamics in fluids in microgravity. Gravity often dominates the equations of motion of a particle in a fluid, so microgravity provides an ideal environment to study the other forces, such as the pressure and viscous drag and especially the Basset history force. We have developed diagnostic recording methods using holography to save all of the particle field optical characteristics, essentially allowing the experiment to be transferred from space back to earth in what we call the "virtual apparatus" for on-earth microgravity experimentation. We can quantify precisely the three-dimensional motion of sets of particles, allowing us to test and apply new analytical solutions developed by members of the team as reported in the 2001 Conference (Banff, Canada).
In addition to employing microgravity to augment the fundamental study of these forces, the resulting data will allow us quantify and understand the ISS environment with great accuracy.
This paper shows how we used both experiment and theory to identify and resolve critical issues and produce an optimal experiment design that exploits microgravity for the study. We examined the response of particles of specific gravity from 0.1 to 20, with radii from 0.2 to 2 mm, to fluid oscillation at frequencies up to 80 Hz with amplitudes up to 200 microns. To observe some of the interesting effects predicted by the new solutions, requires the precise location of the position of a particle in three dimensions. To this end we have developed digital holography algorithms that enable particle position location to a small fraction of a pixel in a CCD array. The spaceflight system will record holograms both on film and electronically. The electronic holograms can be downlinked providing real time data, essentially acting like a remote window into the ISS experimental chamber. Ground experiments have provided input to a flight system design that can meet the requirements for a successful experiment on ISS. Moreover the ground experiments have provided a definitive, quantitative observation of the Basset History force over a wide range of conditions. Results of the ground experiments, the flight experiment design, preliminary flight hardware design, and data analysis procedures are reported.
Keywords: particle dynamics, Stokes flow, microgravity, holography
INTRODUCTION
The science problem
Particles suspended in a fluid react and move under numerous forces imposed upon them. For a sphere that is not spinning in a uniform fluid and in low Reynolds number conditions, these forces can be summarized as the following:
Gravitational: In a gravitational field this force causes the particle to sink if it is heavier than the fluid. A constant force.
Buoyant: In a gravitational field this force causes the particle to rise if it is lighter than the fluid. A constant force.
Pressure: If the fluid accelerates, then it applies a pressure on the particle surface. This is the same as a buoyant force, except in the direction of the fluid acceleration. It is proportional to the first derivative of the absolute fluid velocity with respect to time.
Stokes drag: This force is due to a type of friction of the fluid on the particle as it moves through the fluid. It is proportional to the relative velocity (velocity difference between the fluid and the particle), or the zeroth derivative of the velocity. It also depends also upon the viscosity of the fluid and the particle radius.
Virtual mass: This force of the fluid on the particle occurs because the particle must accelerate some of the surrounding fluid to move it out of the way. Due to the inertia of the fluid, the force is proportional to the particle acceleration relative to the fluid or the derivative of the relative velocity.
Basset history drag: When a particle is accelerated in a fluid a finite amount of time is required for the forces to transfer through the fluid to the particle and vice versa, since the fluid is deformable. The history force accounts for this time difference. It can depend on both relative velocity and acceleration and is proportional to the half derivative of the relative velocity. When the fluid surrounding the particle moves sinusoidally in time the half derivative is approximately proportional to the sum of the velocity and acceleration.
Inertial: The inertia of the particle, due to its mass, produces a force that is equal and opposite to the sum of the forces accelerating the particle, and it is proportional to the acceleration of the particle, the derivative of the particle absolute velocity with respect to time.
The history force is the most illusive of the forces and is the most difficult to observe. Observing, quantifying, interpreting, understanding, and evaluating the importance of this force are a primary focus of our investigation. A more physical insight into the history force comes about through a few interpretations. Since the term accounts for the finite time required for the transfer of viscous and pressure forces between the particle and the entire volume of surrounding fluid, one would expect the actual forces and related movements of the particle to be less than that predicted without accounting for the history term. This is only significant when the movements associated with velocity and acceleration are in the same time scale as the viscous transport time, the time required for information to move from the surface of a particle to a particle radius away. Unless relative acceleration exists between the particle and fluid the history force quickly decays to zero.
Historical Perspective of Particle Equations of Motion and Their Solutions
A detailed literature review, provided by Coimbra and Rangel, is briefly highlighted here. The earliest significant work on particles in fluids was done by Stokes (1845), who proposed an expression for the drag force at low Reynolds numbers. The Stokes equation is not an equation of motion for the particle but rather a simplified momentum equation for the fluid (the Navier-Stokes equation without any inertial term).
A significant improvement in Stokes work came about over 40 years later when Basset and Boussinesq (1887 and 1885, independently) added the local derivative term to the Stokes equation (meaning now that the equation allows for time-dependent adjustment of the flow field). The resulting partial differential equation of motion for the particle moving in a quiescent fluid comprised inertial, viscous, pressure, and virtual mass terms. This was an important step because an integro-differential equation for the motion of the particle was generated, representing the first equation of motion that that took into account the relative acceleration between the fluid and the particle.
In 1947 Tchen expanded Basset and Boussinesq's result to include a uniform but non-quiescent flow field (the background flow field can now be a function of time but not of position). He produced a stationary solution (independent of initial conditions) to his first equation (this is key to us because this solution is the one that interest us so far regarding SHIVA).He attempted to expand the technique to a non-uniform flow field but made small mistakes in the derivation leading to an inconsistent equation.
In 1983 Maxey and Riley corrected Tchen's second derivation for non-uniform flows, generating a consistent equation for non-uniform flows that is valid only when Rep approaches 0 since there are no convective effects accounted for. Even at very small Rep, small convective effects can change substantially the behavior of particles in non-uniform flows.
In 1998 Coimbra and Rangel recognized that the history force is proportional to the half derivative of the relative velocity, possibly the first discovery of a force in nature that is proportional to a fractional derivative. This allowed them to solve, analytically, Tchen's first equation (the one for uniform flows), including initial transients. This allows one to calculate the motion of particle from a given initial condition, instead of only the long-term (stationary) solution provided by Tchen.
In terms of the relative dimensionless velocities w = v – u,
where v and u are the particle and the fluid velocity respectively, the history
term is expressed with the half derivative. a is the
ratio of the particle to fluid densities, and velocities are made dimensionless
by the flow characteristic velocity
![]() , and time is made dimensionless
by defining a particle characteristic time
, and time is made dimensionless
by defining a particle characteristic time
![]() =
=
![]() , g is the gravity acceleration,
a is the radius of the spherical particle,
, g is the gravity acceleration,
a is the radius of the spherical particle,
![]() is the specific mass of the
particle, and m is the dynamic viscosity of the
fluid, Tchen’s equation can be written as
is the specific mass of the
particle, and m is the dynamic viscosity of the
fluid, Tchen’s equation can be written as
![]()
In the following order, the terms in the equation are 1)
Inertial 2) Forcing (Pressure) 3) Virtual mass 4) Stokes Drag 5) History Drag 6) Gravity & BuoyancyEXPERIMENTAL STUDY
Focusing on the Bassett History Force
One of our early objectives in the SHIVA project was to assess the importance of each of the force terms and determine if a microgravity environment can be exploited to study those forces that would otherwise be dominated by gravity. Since the history force is the least understood and least investigated force, we elected to emphasize quantifying and understanding this force and it’s importance. The theoretical study was tasked with identifying the regions where the term is the most significant as well as being separable from other forces. This included identifying measurands, parameters, and conditions for meaningful experiments that would confirm the effects of the history term and its importance in the equation of motion.
Ground experiments were designed to establish that the necessary measurements could be made with sufficient accuracy to isolate and quantify the force. Removing gravity would clearly be a major experimental step in relaxing the measurement requirements (for studying any of the other forces) as well as allowing appropriate experimental parameters to be attained. In the presence of gravity all except neutrally buoyant particles sink or rise to the surface making the measurement more difficult as well as increasing the Reynolds number beyond the limits of validity of the equation.
Coimbra and Rangel were able to show through a scaling analysis that the history drag on a particle in an oscillating fluid can amount to roughly 60% of the total force dependent on the relative velocity when the oscillation time is equal to the viscous transport time. This result is a primary basis of the experimental design for the SHIVA experiments so far because it identifies the optimal region in which to experimentally verify the magnitude of the history force as predicted by Tchen's equation.
The resulting analysis defines the time scale factor, S, (ratio of viscous transport time to oscillation time)
![]() ,
,
where
W is the forcing oscillation angular frequency and n is the kinematic fluid viscosity. The relative size of the history force is maximized when S is unity. When the period of oscillation and the viscous transport time are of the same order of magnitude, the unsteadiness of the near field becomes relevant and thus the history drag reaches its maximum.Figure 1 summarizes the results of the scaling analysis pointing out that the experiments should be designed to operate with values around S=1, where the history force dominates.
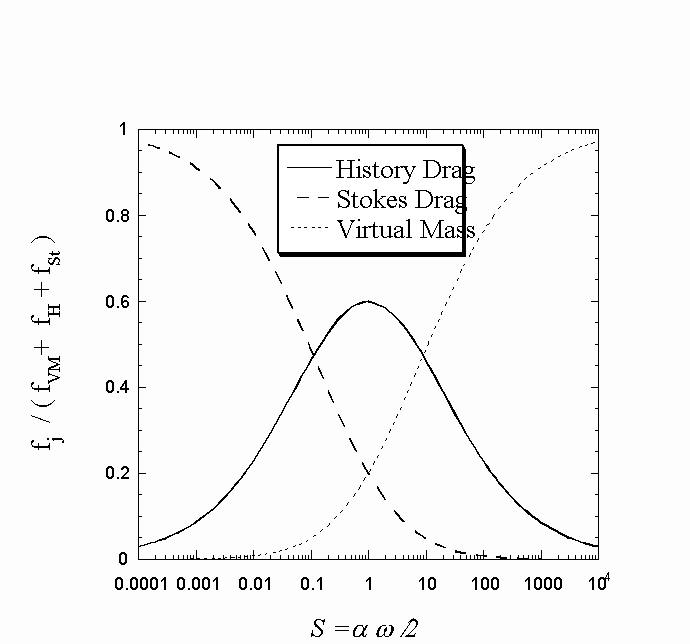
![]()
Figure 1. Relative scaling of the forces for harmonic particle motion.
Experiment Design
The selected experimental parameters are, a , Re, S, and the measurands are h , the ratio of particle to fluid amplitude and q , the phase difference between the fluid and the particle. In searching for an optimal forcing function it was recognized that sinusoidal forcing functions are relatively easy to provide experimentally, retain all of the forces in the equation of motion, and can be selected for S=1. Since the particle and fluid are continuously undergoing changes in velocity and acceleration, the history term is always present. Moreover, in principle any steady forcing function can be represented as a series of sinusoids, so the study represents a broad range of forcing functions.
This choice provides additional insight into the history force by reducing it to an expression that is proportional to the sum of velocity and acceleration. By definition,
dn/dt(sin w t) =w nsin(w t+np /2).
We know from the stationary solution to the equation of motion that the resulting particle velocity also can be approximated by a sinusoid, and therefore the difference between the particle and fluid velocities will also be sinusoidal.
Therefore:
Zeroth derivative - Forces proportional to velocity or velocity difference ~sin(w t).
Half Derivative - The history force ~w 1/2sin(w t+ p /4) = 0.707w 1/2 (sinw t +cosw t).
First Derivative - Forces proportional to acceleration. ~w sin(w t+p /2).
Note that if the relative velocity is sinusoidal, then the history drag is proportional to the sum of the relative velocity and acceleration. This means that the history drag is out of phase with both the velocity and the acceleration. One would expect that it would be most observable in a transition region between conditions where velocity and acceleration dominate, and that is exactly what the Coimbra-Rangel scaling analysis showed. It told us precisely where to look.
In a sinusoidal fluid movement the three forces (history drag, virtual mass, and Stokes drag) vary from zero to a maximum at different times in each cycle. The virtual mass drag peaks when the movement is at the largest amplitude (maximum acceleration), the Stokes drag peaks at the zero position (maximum velocity), and the history drag peaks halfway between (maximum sum of velocity and acceleration). Interestingly, the history and virtual mass forces can be in the opposite direction of the fluid motion.
A typical case selected is for polypropylene particles (a =2) in Krytox oscillating at 60 Hz, which leads to a value of S=1. To maintain attainable, measurable amplitudes and frequencies for a fluid cell required that we operate in a range below 100 Hz for amplitudes of a few hundred microns. Even this combination introduces a severe vibration problem to deal with, especially when precision measurements are required. To produce the measurements specified from the theory necessary to isolate the history force required locating the sphere in the fluids to micron precision.
Ground Experiments
We designed ground experiments to support the flight design. The objectives of the ground experiments were:
Establish that the measurement accuracy and resolution required to achieve our project goals are achievable.
Prove that the flight experiment is feasible with attainable hardware.
Evaluate the capability of critical hardware components to meet experiment requirements (e.g. laser power and coherence, photographic film properties)
Conduct the experiment and specifically quantify the history force to the greatest extent possible on earth.
Gain experience and test concepts that will be necessary for conducting a space flight experiment.
Develop data reduction and interpretation methods.
Identify and resolve critical issues.
Determine how much can be gained by conducting the experiment in space.
Critical Issues resolved in ground experiments
The following are a few of the many critical issues that were identified and resolved in ground experiments:
1. Conducting experiments in a gravitational field that would be representative of microgravity results, while also retaining low Re number conditions.
2. Locating the particles with micron precision, at least some of the time on video cameras in a form that can be down linked. Since a typical pixel size for a digital camera is 5-10 microns, either pre magnification or sub pixel measurements would be required. Since particles are free floating, their exact position is unknown so focused imaging would require continuous refocusing.
3. Oscillating an acceptable experimental fluid/particle chamber sinusoidally with frequencies up to 100 Hz at amplitudes up to 200 microns, without
a. vibrating the optical system unacceptably,
b. sending unacceptable forces into the space station,
c. introducing harmonics.
Maintaining optics stable to micron precision could require extremely rigid mounting. The forcing mechanism experiences equal and opposite forces, so it will move opposite to the chamber unless much more massive.
4. Keeping a particle at least 10 diameters away from a wall or nearest neighbor to prevent interaction and interference. This requires experiments with particles sufficiently small to retain a small cell.
While many other minor issues arose in the course of the experiment design, these were the most challenging.
The Tethered Particle Method
The problems of conducting the experiments on earth include particles rising or falling too fast, thus violating the low Reynolds number assumption, and the difficulty in locating the particle position with great accuracy when the particle is rising or falling. In a gravitational field as the fluid to particle density ratio,
α, approaches unity, the rate of rising or sinking of the particle is small, a precise measurement of particle position is easy to make, and the Reynolds number is small. However, to study the history drag as α approaches unity requires better measurement accuracy because η also approaches unity. Our ground investigation has addressed this in various ways, but the most versatile so far has been a tethered particle method. Particles are tethered on a fiber, attached with superglue, that holds them in the proper position for recording. Tiny holes were drilled in the particles at the attachment points. This simulates microgravity better, gives much more time, and simplifies recording at the expense of the interference of the tethering fiber.We modeled the effects of the tethering fiber and also conducted control experiments to identify where they could not be neglected. Analysis suggested that tether effects could be significant. We have observed tether effects experimentally by noting where the results differ from theory (This is not guaranteed to be a tether effect) and by tethering neutrally buoyant particles and comparing with untethered results. In the latter experiments, tether effects were shown to be severe for tethers larger than 50 microns in diameter, especially for particles under 1 mm diameter and at frequencies above a few Hertz. Tether effects for 50 micron diameter particles were negligible for particles larger than 1 millimeter in diameter and frequencies below 60 Hz. We tried a range of materials starting with human hairs (about 100 micron diameters), nylon strings (50 microns), and ultimately copper wiring manufactured for use with MEMs devices (20 micron diameters). The results with the smallest copper wires appear to be excellent with little or no tether effect for particles larger than 500 microns diameter, at frequencies up to 80 Hz. and amplitudes up to 100 microns.
Figure 2. Cell showing tethered polypropylene and steel particles (note particles near the wall). illustrates a four centimeter cubic cell with both heavy and lightweight particles tethered from the top and bottom of the cell respectively.
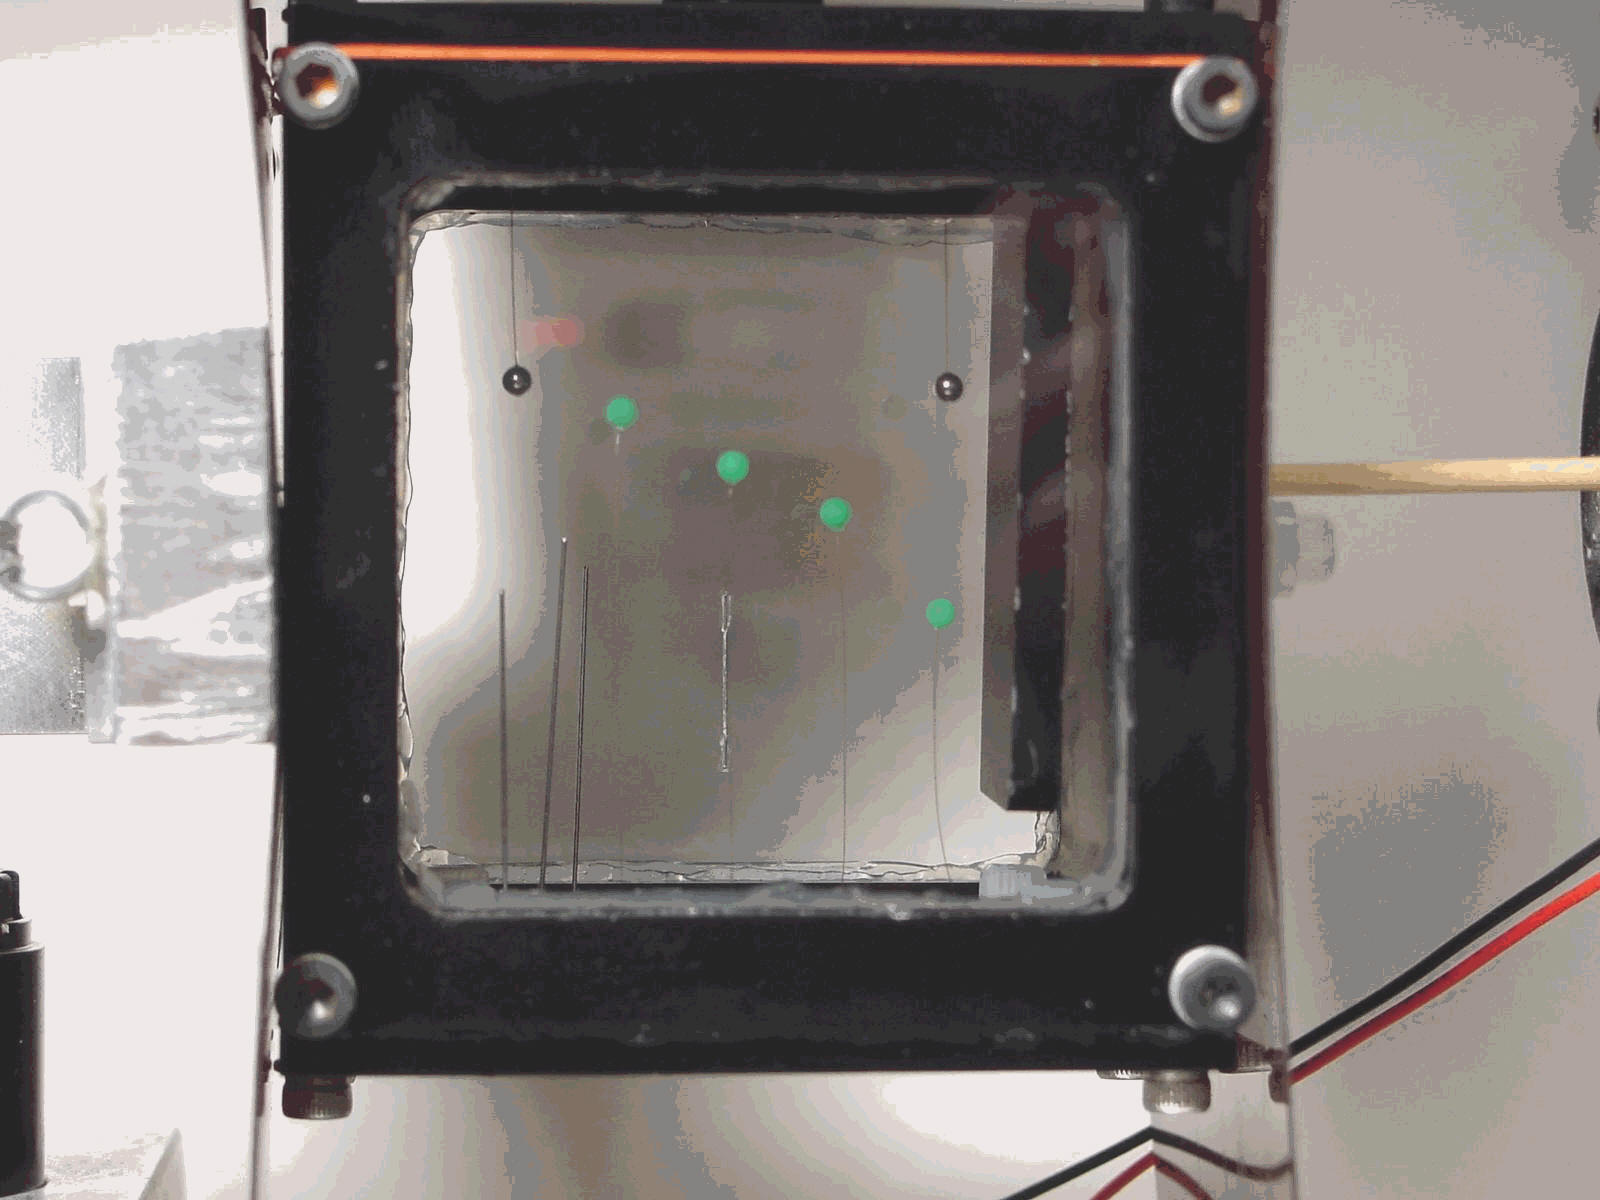
Figure 2. Cell showing tethered polypropylene and steel particles (note particles near the wall).
Shaker Systems
We attempted to use various shaker systems to provide the sinusoidal forcing function, including mechanical (cam) and electromagnetic forcing of various types. Each one has a characteristic problem and all added significant vibration to the optical table, making precision measurements difficult. The most reliable system, finally adopted, employed a voice coil driven by an electromagnetic field coil. Figure 3 shows the system with two spheres (2mm radius) tethered in the fluid. A piezo sensor determines the velocity and position of the cell at all times. A Fourier analysis of this signal determines the frequency content in the system and allows us to avoid resonances, harmonics, and unwanted frequencies.
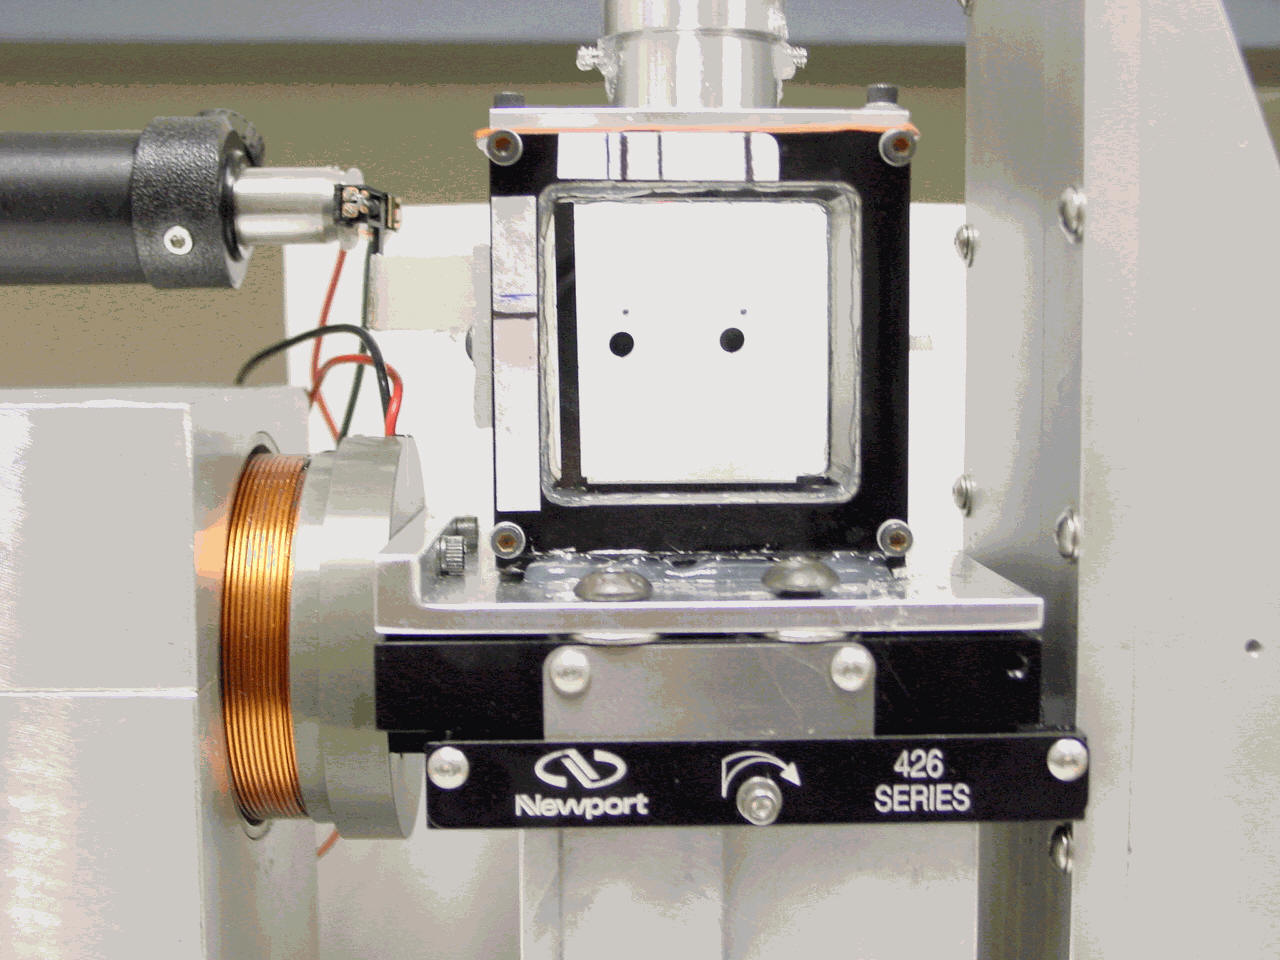
Figure 3. Shiva Ground Cell showing two spheres (2mm radii) tethered in the fluid- filled cell by fibers to counteract gravity driven buoyancy. Small spheres attached to the cell window serve as a reference. The voice coil shown at left drives the cell at frequencies up to 100 Hz and amplitudes up to 200 microns. Digital holograms of the cell are recorded and used to determine the relative movement of the spheres and the fluid. A piezo-electric sensor (shown upper left) measures the cell position at all times.
Minimizing Vibration
The vibration problem was severe and would become worse in space because of weight restrictions. Vibration added errors to the position measurements by transferring energy into the optical table. Also, the ISS "Good Neighbor Policy" would require that the system be isolated from the ISS at all times. We solved the problem in the ground experiments at first by making the mounts heavy and rigid, but this solution would not apply in space. We resolve this issue by mounting both the shaker and the cell on a dual traverse, so that the two could act and react with the only transfer of vibrational energy into the optical table being through friction in the traverses.
Figure 4 schematically illustrates the cell and reactionary mass mounted on traverses, Figure 5 shows the actual cell in use. The counter mass is about 10 times that of the test cell, so it moves with an amplitude of about 10 microns. The traverses also constrain the movement precisely to a straight line. With this configuration negligible vibration is experienced in the optical table and the Good Neighbor Policy will be easily satisfied.
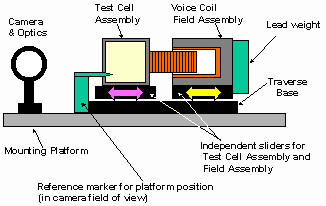
Figure 4-Schematic illustration of the counter mass system for minimizing vibration transfer to the optical table.
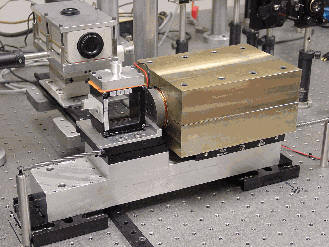
Figure 5-Shiva Ground cell showing voice coil and brass reaction mass at right and cell at left. The cell and voice coil are each mounted on traverses and are driven in opposite directions by the voice coil at frequencies up to 100 Hz and amplitudes up to 200 microns. This configuration eliminates potential unwanted vibration that would be transferred into the apparatus as well as to other experiments on the Space Station. Electronic holograms of spheres in the cell are recorded on the camera, shown upper left, allowing a precise measurement of the sphere and cell positions.
Figure 6 shows the entire apparatus including monitoring instrumentation and optics.
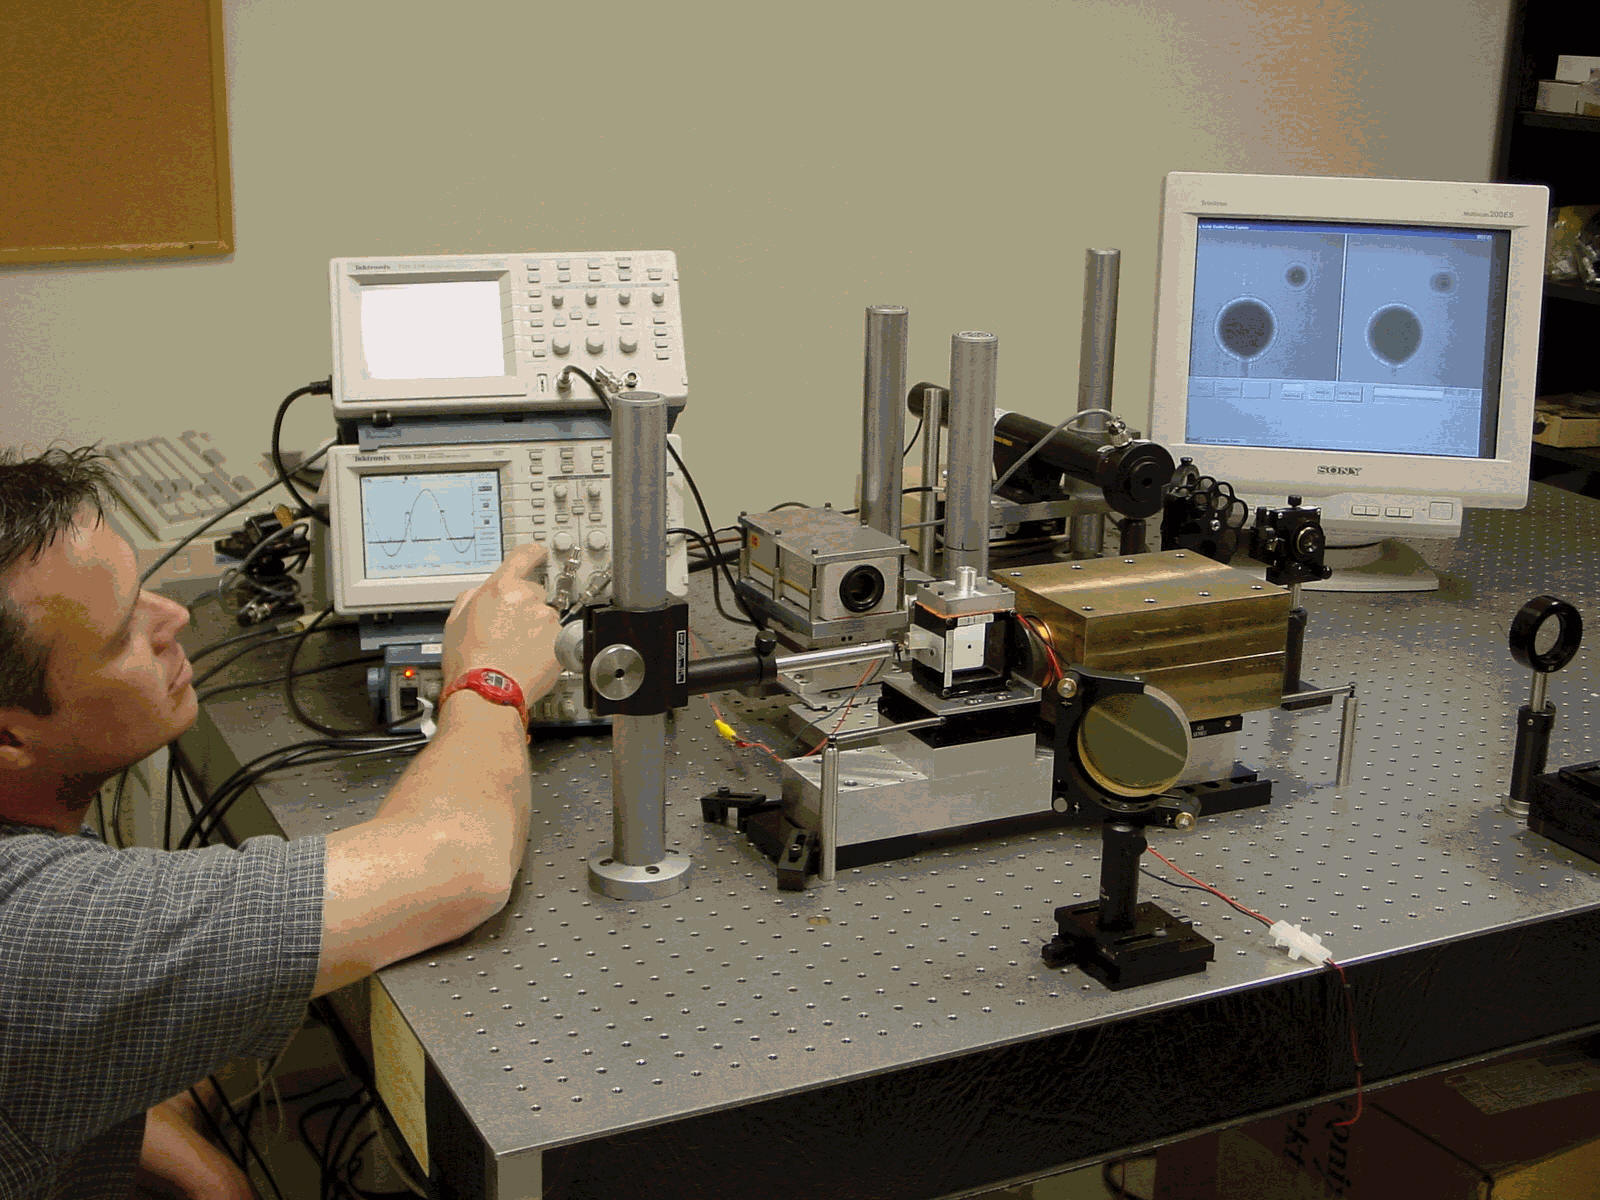
Figure 6- Shiva Ground Experiment showing cell, voice coil, and reaction mass electronic holograms of spheres tethered in the fluid-filled cell (upper right), and instruments to determine precise cell position at all times (upper left).
Locating Particles with Micron (Sub Pixel) precision
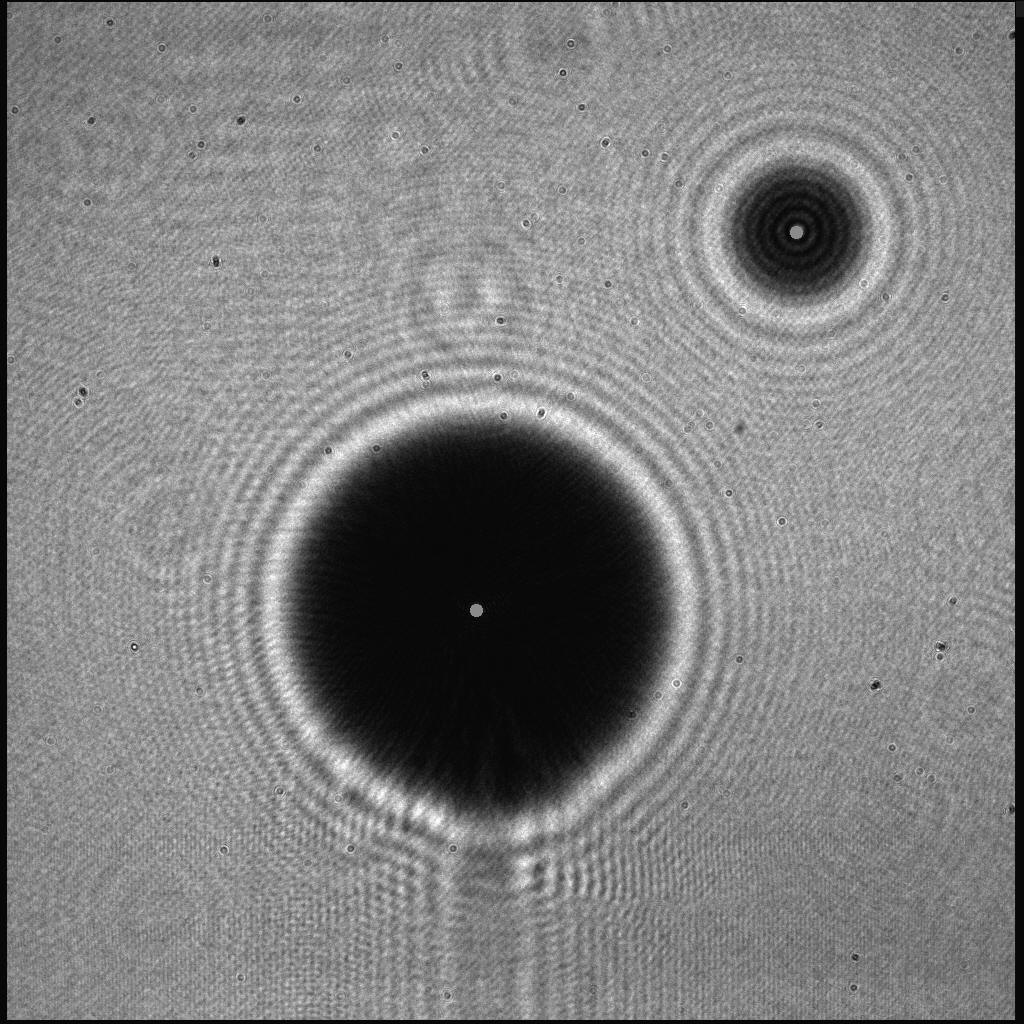
The problem is to locate the two extreme oscillation positions of the particle in the fluid with great precision and compare that with the fluid amplitude of oscillation. We selected holographic recording as a method to achieve microscopic position location without focusing. We have used holography to track the precise position of particles in a fluid in previous applications including spaceflights,. Very short exposures are made at the oscillation extrema by shuttering a laser beam used for the recording with the timing signals being extracted from the piezo-device that locates the cell position. We can also determine the phase difference of the cell and particle movement by making several measurements and varying the shutter time delay.
Achieving the desired resolution over the entire test chamber is not difficult with recording on photographic materials. The resolution is limited only by the effective hologram diameter and distance from the particle. However, to process data during the spaceflight requires a downlink of information. This can be achieved with CCD’s and digital holography, but the resolution limit and size of the detector arrays (typically 5-10 micron pixel sizes) over a 1cm2 presents a challenge when micron precision is desired. In digital holography the problem reduces to one of locating the center (or amount of movement) of a diffraction pattern to 0.1 pixel or better.
By using cross correlation methods we achieved better than 0.1 pixel position location. Figure 7 shows the appearance of an electronic hologram of a tethered 2mm radius sphere in an extreme position during oscillation. A smaller sphere at 1 o’clock is attached to the cell window for reference (The fluid and cell are assumed to move together.). The diffraction pattern inside and outside the particle shadow can be used to produce a correlation mask. The bright spot at the center of the shadow is the Poisson’s spot. A cross correlation of this mask has a distinct peak at the particle center, with better than 0.1 pixel position sensitivity.
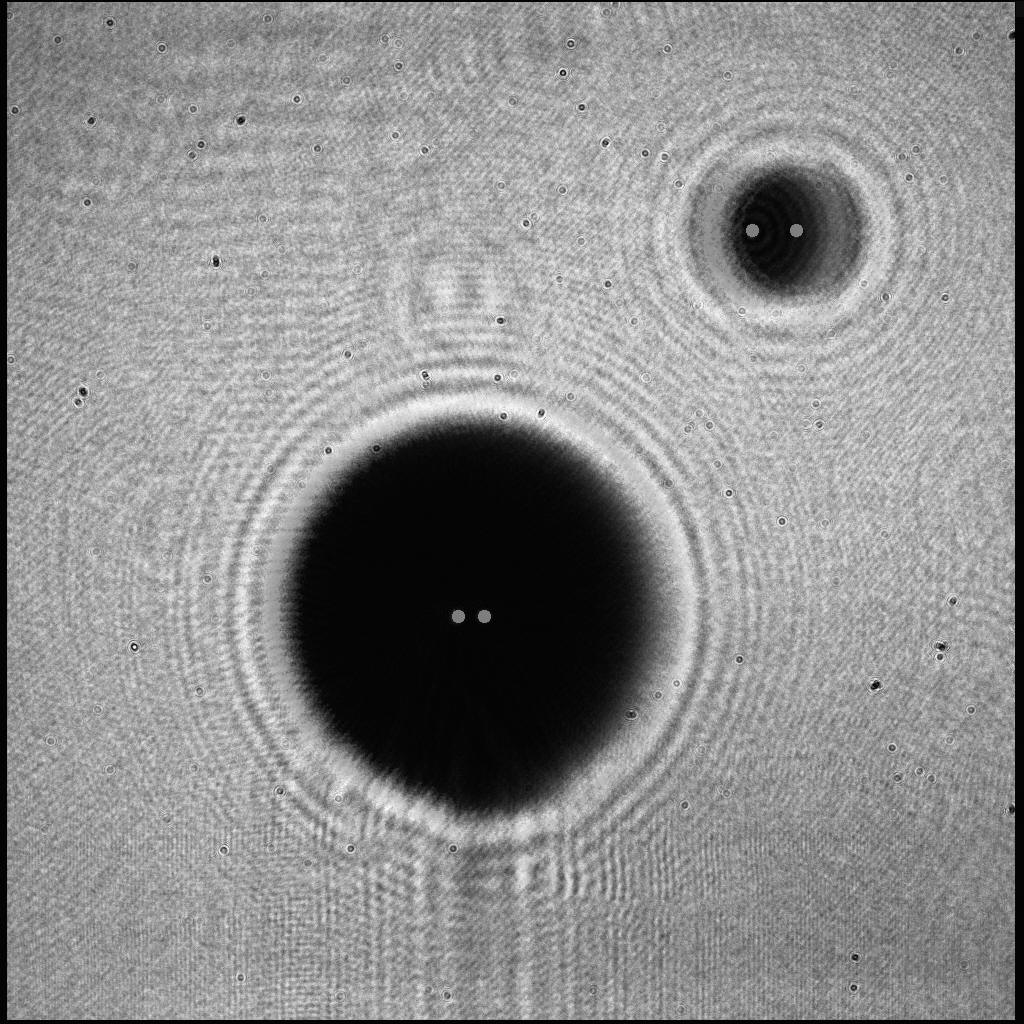
The right hand figure is a superposition of two electronic holograms made at two different extrema showing the amount of movement in the oscillation cycle. The difference in fluid and particle movement is clearly evident here.
|
|
|
|
Spheres in Extreme Left Position |
Superposition of Two Electronic Holograms of Spheres in Extreme Left and Right Positions |
Figure 7-Electronic Holograms of 1mm and 2 mm Radii Spheres. The Large sphere is tethered in a fluid-filled cell by a fiber (shown at 6 o’clock) to counteract gravity, and the small sphere is fixed to the cell window for reference to determine fluid movement. The right hand figure is the superposition of two electronic holograms made in extreme opposite cell positions as the cell oscillates at 60 Hertz. The bright spots at the centers of the diffraction patterns, the "Poisson’s spot" (enhanced here), show the relative movement of the fluid and the tethered sphere. The amount of movement is determined precisely by cross correlating the diffraction patterns of the holograms made at different times, enabling resolution that is much better than the camera pixel size.
Results from Ground Experiments
Experiments were completed for a full range of frequency as well as three particle types. Our ground experiments have established and quantified experimentally, with a large amount of high quality data and with a clear margin, the existence of the history drag, that has escaped definitive observation since it was first proposed over 50 years ago. Unlike other forces on particles in fluids, the history force, though anticipated through theory, has never been established or even clearly observed experimentally because it is usually masked by other forces and is extremely illusive.
Our findings are compared with theory in Figure 8, which is for particles lighter than the fluid, and Figure 9, which is for the case of particles heavier than the fluid. The amplitude ratios of particle to fluid, h , are plotted versus the time scaling factor, S. In each case, the lightly drawn curves are the expected values without the influence of the history force. These figures clearly show the importance of the history force in this region.
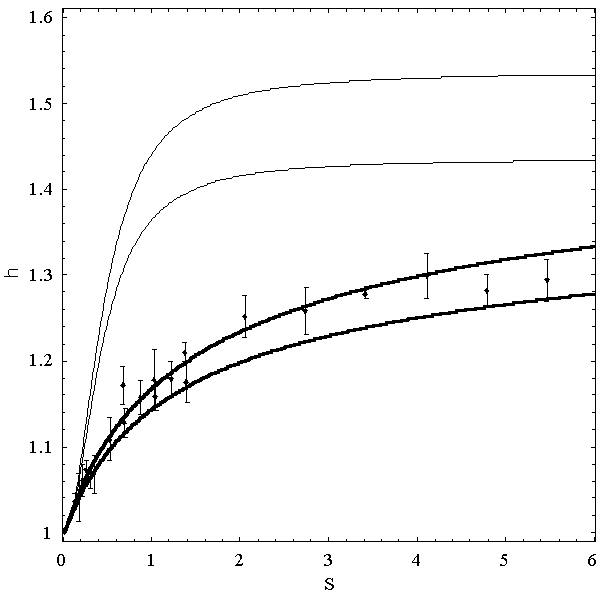
Figure 8. Displacement ratio (
h) as a function of dimensionless frequency (S) for values of fluid-to-particle density ratio (a) close to 2. All experimental data points are for 1.835 < a < 2.100. The upper thin curves correspond to the solution without the history drag for a = 2.100 (the very top curve) and for a = 1.835 (the second curve from top to bottom). The thick curves correspond to the full solution for the same limiting cases.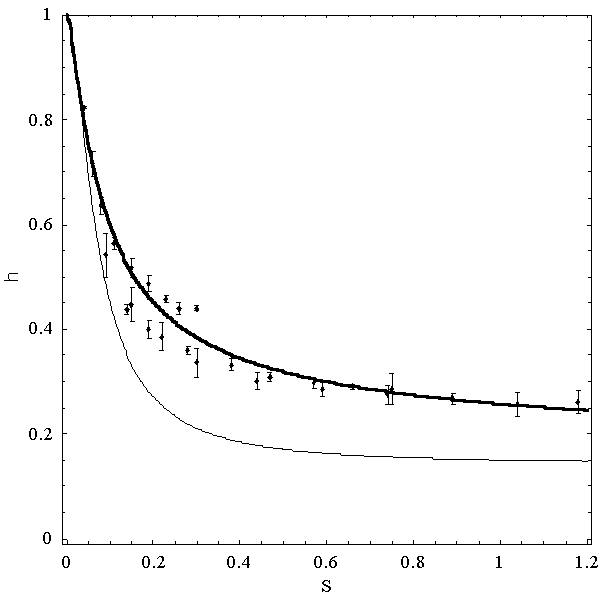
Figure 9. Displacement ratio (
h) as a function of dimensionless frequency (S) for values of fluid-to-particle density ratio (a) close to 0.1. All experimental data points are for a = 0.1. The lower thin curve corresponds to the solution without the history drag for a = 0.1. The thick curve corresponds to the full solution for the same limiting cases.We have proven in ground experiments that we can locate a particle in a vibrating test cell with a precision sufficient to measure the effect of the history term on the particle amplitude. We tested extensively the cases of 1 and 2 mm-radius polypropylene particles in a Krytox liquid filled cell that is shaken at frequencies up to 100 Hz with amplitude of up to 0.2mm. The required precision is about 5 microns depending on the amplitude of vibration and the value of
α. We have run many experiments around the region where the scaling function S = 1 (S is the ratio of viscous time to vibration period, and at S equals unity the motion information transfers about one particle diameter during one cycle of oscillation) and with a = 2.1. The effect of the history term peaks at about 60 Hz for this case making this an optimum frequency for observing the history term effects. A vibrational amplitude of 100 microns results in a 15-micron difference with and without the history term. We have shown in our ground experiments that we are at least a factor of two better than the resolution required to quantify the effect.The Flight Experiment
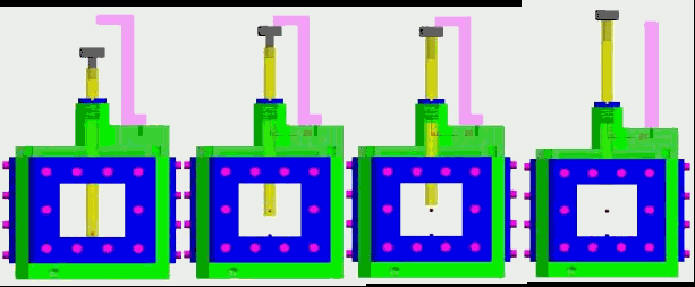
The flight experiment includes a wide range of the parameters a , Re, S, while measuring h , the ratio of particle to fluid amplitude and q as well as tracking particle movement over long periods of time in the space station under the influence of the space station movement. All of the parameters will be varied well outside of the range of validity of existing theory to test the limits of these theories. Precision tracking of particle movement over long periods of time under the residual accelerations of the space station will allow us to make some of the most precise measurements of low frequency residual acceleration of the space station ever done. Particle number ranges from single particles injected into the cell to many particles of different size in the cell at once. A special particle injection mechanism, shown in Figure 10, was developed to allow placing one or two particles near the center of the cell. These will allow us to study the simplest case of the particle with no interactions to more complex cases including interactions.
|
|
|
Figure 10-Particle injection procedure |
The particle is contained at the end of a cylindrical sleeve, shown is the left most figure, which is withdrawn by a screw mechanism as shown in the second figure from left. When the sleeve reaches the cell center, as shown in the third figure, a plunger pushes the particle into the fluid. Then the cylinder is withdrawn completely from the cell leaving it suspended at the cell center. A bellows that is attached to the cell allows the cell to be completely filled with fluid.
Figure 11 diagrams a simple and yet comprehensive flight experiment optical apparatus. We selected hologram recording both on film for the highest resolution and volume coverage and a digital camera to allow us to downlink particle position data. Holograms will be recorded on 70 mm film with two lines of site through the cell (2) to cover particle movement in all directions with the highest fidelity. A digital camera (4) located above the optical line of site shown in the figure records the position of particles that lie in the central 1cm2 cross section covered by the camera sensor. A second video camera will provide a view of the entire cell to allow a continuous view of particles in the cell at lower resolution. A light emitting diode illuminator is provided for this purpose. Laser light is separated from the LED light by beamsplitters (1), (2), and (3) and filters.
|
Figure 11-Spaceflight experiment |
|
configuration. |
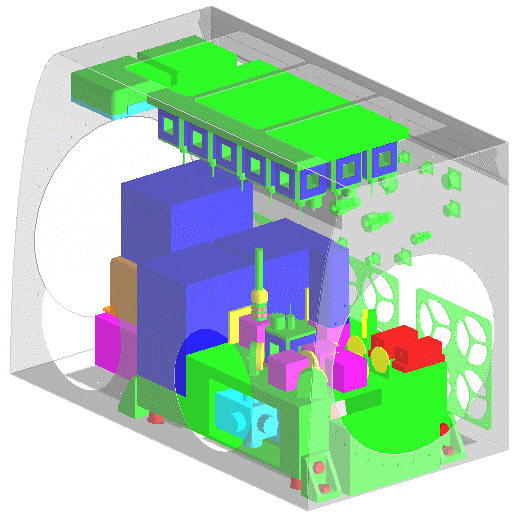
The experiment will be conducted in the Microgravity Sciences Glovebox (MSG). A preliminary design is illustrated in Figure 12, which incorporates the optical system shown in Figure 11, with the dual axis traverse, electromagnetic shaker, and 16 different cells preloaded with various particle and fluid types, which cover the selected parameters for the study. The cells are designed so that they can be easily installed in the system with a quick release mechanism and a specially designed alignment feature that positions the cell accurately.
|
|
|
Figure 12-Flight Experiment Hardware Design Shown Installed in the Microgravity Science Glovebox |
In the foregoing, we have presented some results of a ground based experimental program that is designed to support the flight experiment SHIVA. Using a tethered particle method to simulate microgravity we conducted a wide range of experiments, identified and resolved what appear as the most challenging obstacles to a successful experiment and have developed the necessary methods to meet experiment goals. The tether has a measurable influence on smaller particle motion both as predicted by theory and as observed in experiments. We have proven that we can determine the position of a particle and fluid with sufficient accuracy to meet the objectives of the experiment. We have verified the ability to quantify the elusive history force for a limited range of experimental parameters that can be met on earth. We then presented a preliminary flight experiment and optical system design that can provide a comprehensive coverage of parameters.
Acknowledgments
This is a NASA flight definition NRA (NAS8-98091) under topic NRA-96 HEDS-02. The NASA management team includes Melanie Bodiford, Project Manager, Dr. David Smith, Project Scientist, Bill Patterson, Systems Engineer, all from Marshall Space Flight Center. The authors wish to acknowledge Michael Dempsey of MetroLaser for conducting much of the experimental work.
Trolinger, J.D., Lal, R.B., McIntosh, D., and Witherow, W.K. "Holographic Particle Image Velocimetry in the First International Microgravity Laboratory aboard the Space Shuttle Discovery", Applied Optics, Vol. 35, No. 4, pp. 681-689 (1996).